
Since the corona pandemic started to spread worldwide, many people who are enthusiastic about data science jumped into publishing forecasts of death tolls and the number of infected people. Though any discipline should serve the public needs at the right time, many misconducted analysis come into being. In this article, I’ll explain some common mistakes made during these kinds of corona analyses to highlight the important considerations that people should take into account.
Specifically, I’ll be covering the following topics. I hope you’ll find my discussions helpful if you’re a data scientist or a data science enthusiast.
- Overfitting made easy by curve-fitting
- Dynamic nature of the data generating process
- Small samples and the biases
- The luxury of working with a single variable
- Incorporating domain knowledge
1. Overfitting made easy by curve-fitting
Probably the most common fallacy people have made in their corona pandemic forecasts is that they bring forth how their models fit into the data during the training. To be more concrete, many people believed pandemics spread exponentially, and the current epidemic should follow the same pattern. Although the exponential growth hypothesis rests on some previous pandemic spreads, some approaches people followed are flawed in some respects.
One way to model an exponential growth pattern is to use sigmoid curves. I observed that especially the people without a solid data science background have tried to fit a sigmoid curve to the data and get their predictions along the rest of the fitted curve. When things turned out to be different, like first saturating and then growing exponentially again, these people adjust their analysis by appending another sigmoid curve starting from the end period of the first one and name this approach as a double sigmoid model. Now, this is overfitting in its entirety! Here’s what I mean:
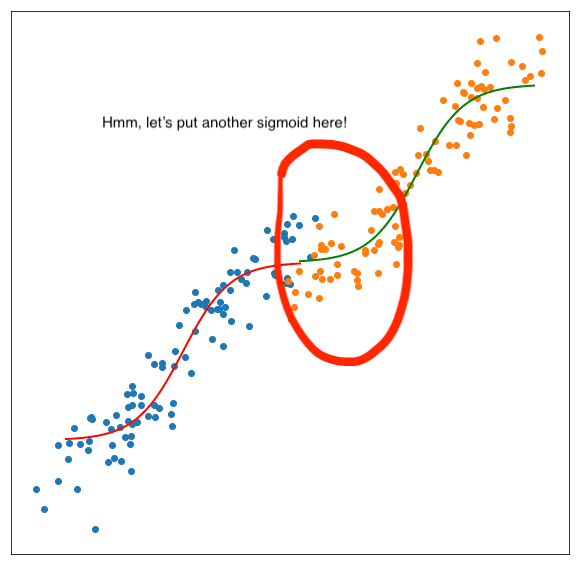
Put another sigmoid on top of the previous one to make sure everything fits perfectly!
This attitude not only makes your model useless in terms of its generalization capability but also can’t make you a great painter in the data science world. The goal of the forecaster isn’t to fit the perfect shape into the data but instead to capture the data generating process in the training data so that the forecasts keep following the movements of the unseen future observations.
2. Dynamic nature of the data generating process
One important reality during this recent pandemic is that governments and people worldwide have taken actions based on their estimates of the spread of the virus. For example, when a government believes that the virus will spread swiftly given the current circumstances, then it can take additional restrictive actions to tame the velocity of the spread.
That is to say, the factors that affect the spread of the virus and hence the number of affected people change dynamically in response to the current forecasts. This makes modeling the pandemic more challenging, if not impossible. In the economics literature, this is known as Lucas Critique. To cope with this, we need to develop simultaneous equation models or general equilibrium models that are not easy for the current data science community to take on..
If your analysis has taken seriously by the people and the government, then your model will prove to be wrong just because of this!
3. Small samples and the biases
Working with small samples isn’t very common in the machine learning world, whereas statisticians get used to working with small sample sizes for over a century. When we talk about small sample, we mean datasets that are too small compared to the true population. In this respect, small sample may mean 30 observations for some tasks whereas 10.000 can be so small for some others. Special techniques have been developed for a long time to tackle the problems associated with the small sample size. But, what’s the problem with the small samples?
In short, the main problem is that when working on small samples, we can’t rest on the assuring pleasures of the central limit theorem and the laws of large numbers.  That is, a small sample’s representation power of the true population is dubious. However, most of the machine learning algorithms rest on the fact that the sample is enough to represent the true population. In small samples, this is not the case more often than not.
This fact also makes small sample datasets full of biases. Thus, when working on this kind of data, your analysis should consider the potential biases. Some biases that are common in the corona datasets are the followings:
1. Selection bias: The death figures mostly represent the cases of the people who are hospitalized because of corona symptoms and then dead. However, there could be many more cases that are not reflected in the numbers because they couldn’t make it to a hospital or passed away before testing for the coronavirus. Moreover, since the numbers of infected people are calculated from the people who are hospitalized and tested, the numbers are biased towards downward.
2. Measurement bias: The tests used to detect coronavirus are not %100 accurate, and they exhibit false positives and false negatives. Even more, we don’t precisely know the false positive or false negative ratios of these tests as they are the ones that we use when detecting whether a person is covid-positive or not. The result is the measurement bias in the data. So, if these tests have high false negative rates, then the number of infected people become biased downwards or vice versa.
Actually, there could occur many other types of biases, but these two suffice to illustrate the dangers of making assertive conclusions by just resting on this data. Without proper handling of the potential biases, all analysis would inevitably become suspicious in their assertions.
4. The luxury of working with a single variable
Time series analysis has a long tradition, and it’s one of the most established branches of statistical analysis. In time series, we often observe a persistency effect where past values of a variable give hints about future values. The models that incorporate past observations of a target variable are known as autoregressive (AR) models.
Although AR modeling is useful, it’s just a single part of the whole story. Observations like the number of deaths from the coronavirus are results of complex data generating processes. Past values give us useful information about where the figure would go in the future, however many other factors are also in play. So, a reliable modeling approach should incorporate these other factors. Thus, we need to resort to multivariable analysis.
5. Incorporating domain knowledge
Many statistical models and machine learning algorithms are applicable to a wide range of problems. That being said, without the proper domain knowledge about the data, you’re most likely to get stuck somewhere or even misled by the data. In my opinion, there’s no other factor that comes near to domain knowledge when it comes to the reliability of your machine learning models.
An example of spurious correlation. Image source: https://www.tylervigen.com/spurious-correlations
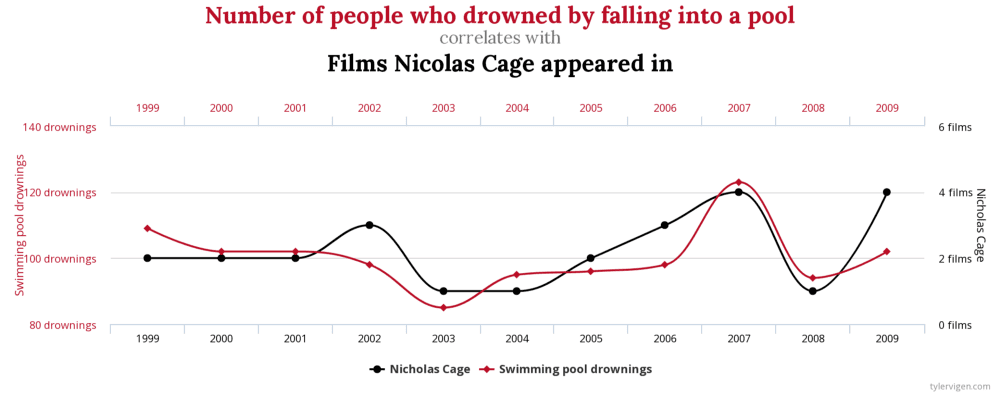
A particular emphasis should be put on the analyses conducted with a few factors (variables) like the ones that only incorporate the past values of the number of infected people. This point is essential because any correlation could be mistakingly judged as a true causality. Even more, you may fall into the trap of spurious correlations such that you may start to think that your set of features are serious contributors to the spread of the pandemic, whereas they are just correlations without any real relationship with your target. The essential toolkit to overcome these fallacies is to have the relevant domain knowledge.
Moreover, when making corona pandemic forecasts, there’s little chance for those who don’t have the proper domain knowledge to find the relevant factors to be incorporated in the models. Hence, it’s inevitable to fall into the situation that I mentioned in the previous topic.
Conclusion
As should be clear from the discussions so far, data science isn’t a field such that you can pour in any data and just fit a model. Data science requires us to understand our dataset and the problems that can be solved using this data. In doing so, we need to take into consideration many factors that can significantly affect the conclusions of our works.
It’s always great to see people trying to learn data science by getting their hands dirty on some datasets. Corona analysis are no exceptions. That being said, I’d be delighted if I could demonstrate that data science is a complex discipline and needs a scientific way of thinking. This should imply that there are still many things to learn for everyone so that we can enjoy continuous learning in this exciting field!
PS: This article is my very first contribution to the blog of Bootrain. Please follow us in every social platform as we intend to roll out many useful stuff very soon.
“Originally published at author’s Blog on 17 May 2020.”